Table of Contents
AmiGO is a web based application which allows the user to browse, query, and visualize data from the Gene Ontology, or any ontology in OBO format. AmiGO can be accessed online at http://www.godatabase.org/cgi-bin/amigo/go.cgi. AmiGO is open source software and can be downloaded and installed as part of the go-dev CVS repository from the Gene Ontology SourceForge.net page.
AmiGO is compatible with most modern operating system/browser combinations with good CSS support, including:
Firefox on Linux, Windows, and Mac OS X.
Mozilla/Netscape 6 on Linux, Windows, and Mac OS X.
IE on Windows, but NOT on Mac OS X. IE on Mac OS X does support CSS standards.
Safari on Mac OS X.
Konqueror on Linux.
Opera on Linux, Windows, and Mac OS X.
In order to use all of the functionality available in this version of AmiGO, we recommend that cookies are allowed and JavaScript is turned on.
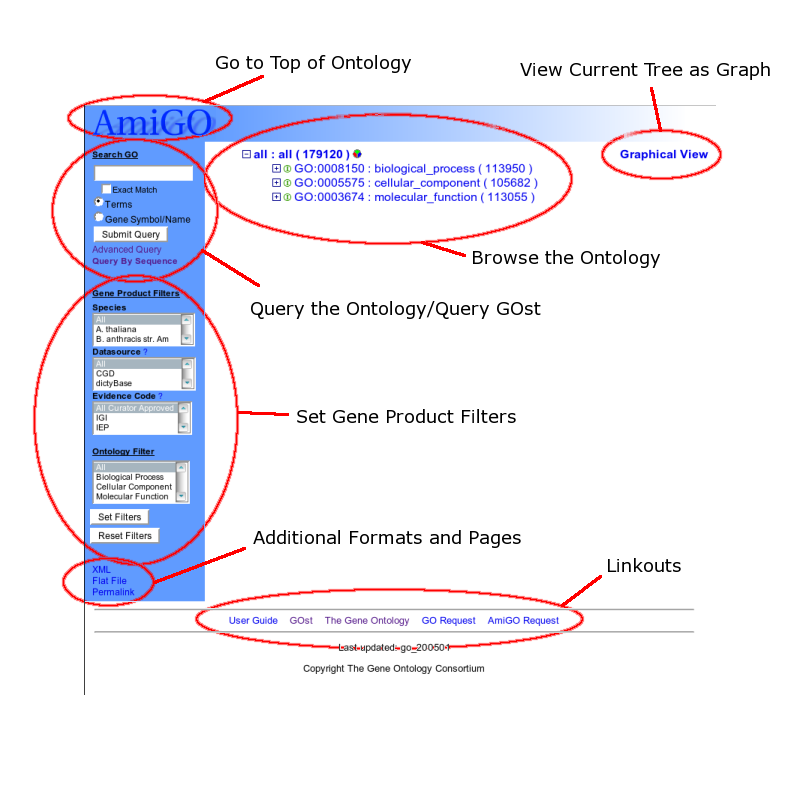
When you go to the URL of an AmiGO instantiation, you have the following options (roughly from top to bottom):
Returning to the initial tree state (go to the top level of the ontology)
Viewing the current tree as a graph
Browsing the ontology using the tree browser
Searching the ontology or associated gene products by keywords and phrases, going to the advanced query page, or querying by sequence using GOst (the Gene Ontology Blast server)
Filtering which gene products will be displayed
Getting the current page in a different format
Going to a related site
The HTML page you view may vary slightly in details.
When you go to the URL of an AmiGO instantiation, you will be presented with a treeview of the top levels of the loaded ontologies.
In AmiGO, the structure of the ontology is presented as a tree of terms. An example of part of a tree is displayed below.

Each term is identified by its unique ontology ID followed by the name of the term. The level of a term is represented by its indentation within the tree. In the above image, you can see that "extracellular organelle" is child term of "organelle" and a sibling term of "intracellular organelle" (to name just one). Furthermore, the relationship type of a term to its parent is represented by the icon immediately preceding the term ID. In the case of the Gene Ontology, the relationship types are "part_of" (represented by the pink 'P' icon) and "is_a" (represented by a green 'I' icon). So in the above case we can state relationships like: "organelle lumen part_of organelle" or "intracellular organelle is_a organelle".
Each line in the tree contains one term and several pieces of information about that term. Let's examine the first line of the above example more closely.

Moving from left to right, the first piece of information about a term is the select/deselect icon. This will be either a '+', '-', or '.' icon. A '+' icon means that the term has children which are not shown in the current treeview. A '-' icon means that the term has been selected and all of its children are shown in the tree (as is "organelle" in the above image). Finally, a '.' icon means that the term is not selected but that it does not have children.
The next item is an icon showing the relationship of that term to its parent, as was discussed above.
Next is the ID and name of the term separated by a semicolon. To see the definition of a term, move your mouse pointer over the term name and let it sit for a second or two. The definition of the term should appear. Depending on your browser you may only see the first part of the definition. Clicking the term name brings you to the detailed term view for that term.
The next item is a number in parentheses. This number represents the number of gene products that are annotated to that term which are loaded in the current database and selected in the current view. This number can change based on the search filters the user selects. For instance, if a user opts to only look at gene products that have been annotated by FlyBase, the number will obviously be lower. For certain filters, the numbers of gene products associated to a term cannot be easily computed. In these cases, the number in the parentheses will be preceded by a less-than (<) symbol. Putting the mouse over the number will give a short explanation of which filters are causing the uncertainty.
The final item in a term line is the round pie chart icon. Clicking this icon will create a helper window displaying a pie chart summary of the numbers of gene products associated to any selected descendants of this term in the tree. Below is an example of "organelle"'s pie chart.

As discussed above, the tree can be browsed by clicking on the select ('+') and deselect ('-') icons on the left side of term lines. This is what the initial tree will look like after we click on the select icon to the left of "cellular_component".

If a term is selected in the tree, the term name will be in bold. In the tree visualization example above, it is easy to see that the term "cellular_component" was last selected.
Now let's look at what happens when "organelle" is selected by clicking on the selector icon (the '+' icon to the very left of the term):

As you can see, when "organelle" is selected the term is bold-faced, indicating that it is a selected term in the current treeview. The plus icon is replaced with the minus icon, which can now be used to deselect it. Also, you will notice that the pie chart icon is now available for "organelle". Pie chart are discussed in more detail in a later section.
You can "drill down" deeper into the ontology by continuing to select terms. Alternatively you can deselect "cellular_component" if you no longer wish to view its descendants in the tree.
Two other things in this treeview are new. The term "cellular_component_unknown" has a '.' icon instead of a selector. This indicates that it has no children and thus is a leaf node. The term "obsolete biological process" is grayed out. Terms which are children of "obsolete_biological_process" are old terms that have been removed from the ontology. They are grayed out as a visual cue that they should no longer be considered current terms.
The ontology can be queried using the form in the upper left of the screen.

AmiGO is queried by entering a simple text string into the form. You can choose to search for either terms or gene products. By default, AmiGO will prepend and append wild cards to a search string and search name and synonym, so the search string "enhancer" will return both 'ESC/E(Z) complex' because of synonym match and "RNA polymerase II transcription factor activity, enhancer binding". The wild cards can be turned off by selecting the "Exact Match" field.
When a query returns lots of results, they are broken into multiple pages and links for each sub page are provided at the end of each page. Breaking results into sub pages has two advantages: database query speed and page manageability.
When you query for an ontology term (the default), you will be presented with a list of "hits". Here are the results of a search for "enhancer".

There are two hits, "ESC/E(Z) complex" and "RNA polymerase II transcription factor activity, enhancer binding". The name and definition of each term is presented. Clicking the term name brings you to the detailed term view for that term.
To the left of each term name is a select box and an icon representing an ontology tree. Clicking the icon will show you the tree view of that term's location in the ontology. You can see the location of both terms in the ontology by either: a) selecting them both using the checkboxes or b) clicking the "Check/Uncheck All" button and then clicking "submit". This will show you a new ontology tree with both terms selected. You can add them as selected terms to a tree that you've already built by browsing or searching. To do this, select the terms you'd like to add, change the option "Draw New Tree" to "Append to Tree", then click the submit button.
Here are the results of a query for the gene product "bcat1".

The query for "bcat1" hits the gene product whose symbol has the exact match "bcat1" from both MGI(Mouse Genome Informatics) and RGD (Rat Genome Database). Each gene product is delineated with a hard break and a meaningful description is provided above its associated terms.
The terms that the gene products have been associated to are also shown, along with the abbreviation of the evidence code(s) for that association and the icon representing the treeview of that term. Putting the mouse over the evidence code abbreviations will give you the full name. A reference/literature link is shown for the evidence.
Clicking the gene product symbol will take you to the gene product details page for that gene product. Clicking the data source name will take you to the description of the gene product at that data source's website. Clicking the evidence code abbreviation will bring you to the source reference that the data source used to make the association. Clicking a term name will bring you to a detailed term view of that term. Clicking a treeview icon in front of a term name will bring you to a treeview of that term.
The advanced queries link, located just below the "Submit Query" button, gives you several new options for querying the ontology.

There is still an input box for text queries and a choice to choose for terms or gene products. However, you can now enter multiple search strings separated by newlines and AmiGO will return all hits to any of the search strings. Additionally, you can enter the name of a file which contains a newline separated list of search terms. This could be useful for finding the results of automated analysis.
In this form, you have the option of selecting exactly which fields you'd like to search to find terms and gene products. When querying for terms you can query these fields:
Name and Synonym (default)
All Fields
Name and Definition
Ontology ID
External References
You can also filter on "Biological Process", "Cellular Component", or "Molecular Function".
When querying for gene products you can search on:
Name and Symbol (default)
Full Gene Name
Sequence Accession
Gene Symbol
Synonyms
Accession ID/DB_Object_ID (gene product ID from external database)
Finally, when searching for gene products you can apply the regular gene product filters.
AmiGO also links to GOst (the Gene Ontology BLAST server). The two links from the main page are the "Query by Sequence" link just below "Advanced Query" and the "GOst" link at the bottom of the page.

The interface is very self-explanatory--you may enter a UniProt accession, paste a FASTA sequence, or upload a FASTA file from you local computer.
There is also a "Threshold" selector located at the bottom of the page. It can be set to values from 0.001 to 1.0, with increments of 10x.
The form on the lower left hand side of the screen labeled "Gene Product Filters" allows you to set filters for which gene products you'd like to see.

You can choose to view only gene products from a given species, annotated by a specific organization, or associated by a specific evidence code. In any given field, you may select more than one value by selecting one, then holding down your control key and selecting others. To instate the filters that you have selected, click the "Set Filters" button.
When filters are turned on, this will be reflected in the gene product counts in the treeview.
Filters will also change the gene product associations that are displayed in the detailed term view.
To reset the filters to their original state, click the "Reset Filters" button below the "Set Filters" button.
Clicking the "XML" or "Flat File" links will bring you to an XML or GO Flat File representation of the tree that is currently selected.
Clicking the "Permalink" link will bring you to a URL that you can bookmark to save the currently selected tree. AmiGO keeps track of the tree you build with user sessions. If your session is inactive for more than two hours, your session will be lost along with a tree you've built. The permalink can save the tree indefinitely. Just add it to your bookmarks.
There are detailed pages for both terms and gene products. These pages generally are displayed in a small helper window that is created when you click on the name of a term or gene product. The helper window allows you to keep a tree that you've been browsing in the main window while exploring interesting terms and gene products in further depth.
The detailed term page is linked to from the term names in the main tree view, from term names in the term and gene product query results, and from term names in the gene product details page.
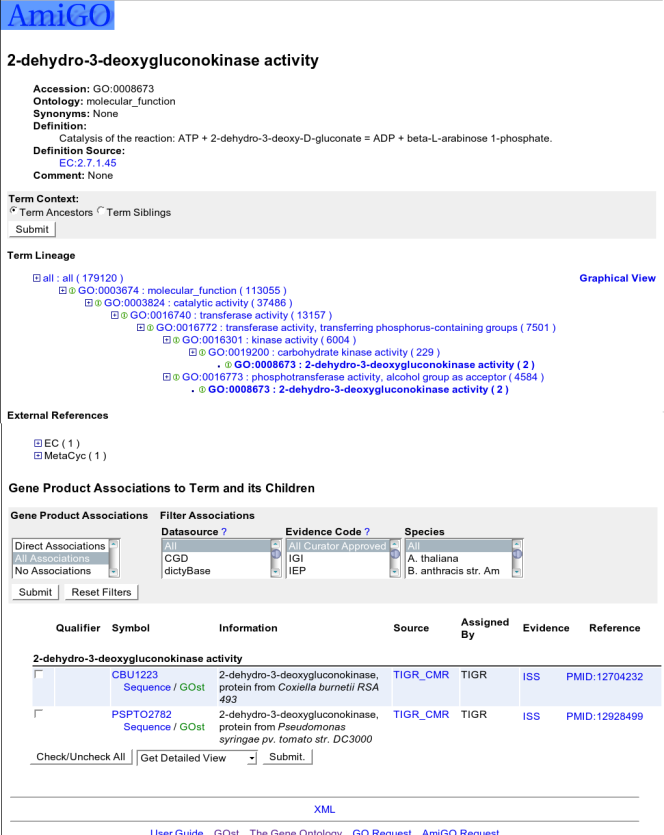
The top of the page shows the name of the term. Following that are the terms Accession, Ontology, Synonyms, Definition and Comment.
The next section, is "Term Context". By toggling and setting these controls, you can either show the selected term's ancestors or siblings and children.
The next section is "Term Lineage". This section shows the DAG view of a term very much like the main treeview, but shows the ancestry lineage to the ontology root. Using the above mentioned "Term Context", you can see the term's parent terms and sibling terms. There is also a link to the graphical view of the term.
The next section shows the "External References" of a term. These links represent the same or related concepts in other databases such as InterPro.
The rest of the page is taken up by gene product associations.
The header of this section is one of three things:
Direct Gene Product Associations
These are gene products which have been associated directly to the selected term.
All Gene Product Associations
These are gene products which have been associated to the selected term OR any of its descendants. Note that the number of gene products displayed in this view should be equal to the number in parentheses following the term name in the tree view.
No Associations
Associations if any are not shown
Following the header and toggle is a grayed section where gene product filters can be set.
Finally, the table of gene products for each directed associated term (term name is shown before associations) is displayed. Column header is shown for each column except the very first one (checkbox column). Information column show gene product full name, type and species.
When the checkboxes to the left of gene product symbols are selected, AmiGO will take you to the gene product details page for the selected gene products or to a FASTA file of the gene product sequences for gene products which have sequences available.
The Gene Product details page is linked to from gene product queries and from term detail pages.

The header of the page displays the gene product symbol.
Following this, the gene product's full name, type, synonyms, data source provider, and the assigning group are displayed. The data source provider links to the gene products page at the provider's website.
Next is a list of terms that the selected gene product has been associated to. Clicking the reference link will bring you to the source reference that the data source used to make the association. To see the full name of an evidence code, just place your mouse over it.
Following the list of terms is a FASTA representation of the sequence of the gene product when available.
The other pages are the pie chart summaries of gene associations and "box and stick" DAG views of term graphs. These pages are drawn in the "helper window".
Pie chart summaries can be reached by clicking the pie chart icon to the right of selected terms in the main treeview. The pie chart will display a summary of gene products associated to the selected term and all of its descendants who have been selected. The number of selected products is limited to the same constraints as in other pages when filters are used.
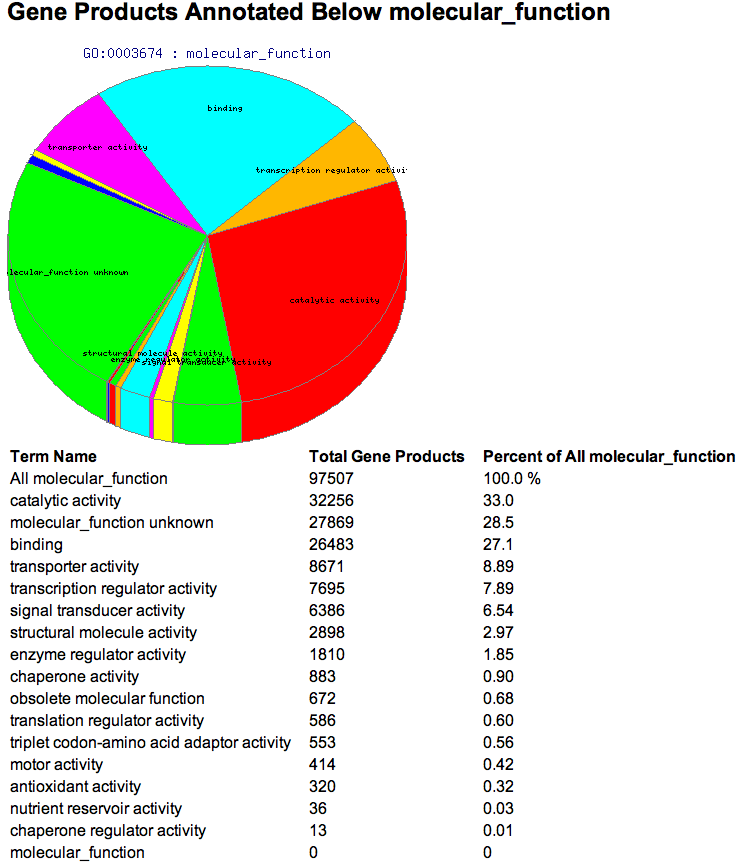
The header displays the name of the selected term.
Next is a pie chart that shows the relative numbers of gene products that have been associated to that term and all of its selected descendants.
The last item in the page is a table summarizing these results. The first column displays the names of the selected term and all of its selected descendants. The first row is titled "ALL " followed by the selected term name. This is the total number of gene products associated to the selected term and any of its descendants, selected or otherwise. The second column shows the number of gene products associated to the term in that row. The last column shows this number as a percentage of the number in the first row (the total number of gene products associated to the selected term and any of its descendants, selected or otherwise).
The graphical view for a term is linked to from that term's detail page.

The header displays the name of the selected term.
The bottom portion of the page displays the actual "boxes and sticks" view of that terms DAG view.
The form in the grayed out section of the window allows you to select the display options for the DAG view, including the color of the boxes, the color of the text and the orientation of the digram layout.